How Might the World of Work Change? It Depends on How You Look at It.
We’ve Entered the Fun House-Mirror Stage of the Recession
“Over the last week, we have now regained about 60-65% of prior year comparable U.S. store sales while reopening under modified operations and with reduced hours.”
– Starbucks CEO Kevin Johnson
When it comes to communicating difficult information, it’s all about the framing. And the quote above is a prime example of doing it well. Think about how you might frame it in the way we typically talk about same-store sales. And by that we mean in reverse: “Over the last week, our U.S. same-store sales were down 35-40% year-over-year.” That sounds quite a bit different, right? Maybe we can call this the fun house-mirror stage of the recession: looking at things from a different angle makes them look very different.
Hopefully this column will provide a stabilizing point of view in these strange times. By many metrics, activity is improving but remains near historically low levels of economic contraction. Perhaps the single-best measure of activity is the New York Federal Reserve Bank’s weekly economic index, which is a collection of data measuring things like retail sales, jobless claims and railroad traffic. As you can see, the index shows just this phenomenon mentioned above. We indeed started to see an improvement the week ending May 9 on lower jobless claims, then quickly reversed to a new low on lower fuel sales and electricity output.

We are also reaching a point in this downturn where meaningful regional dispersion is beginning to show up under the hood of many headline data releases. We talk about “reopening the economy” as if we are one country with one economy, but this crisis has highlighted that we are actually 50 smaller countries with 50 smaller economies. States are setting their own rules for reopening, and will do so at vastly different paces. As we look forward to the potential state of the world 12 months from now and beyond, analyzing the multifaceted nature of the U.S. could be instructive.
The fast-moving nature of this crisis has forced us to look outside the typical government data sources for more high-frequency data, and we have discovered a treasure trove of new data from alternative data sources that will help us analyze the various regional differences, and do it in nearly real time. Utilizing new data from the Harvard-based research and analytics shop Opportunity Insights and Google, we can shed light on the vast difference in activity across the U.S. The following chart shows the change in consumer spending year to date by state, using Opportunity Insight’s data gathered from credit cards, payrolls and other providers. We plot that against Google’s mobility index for retail and recreation locations, a measure of daily visits. We said before that there are sharp differences across states, and this chart does a great job of proving that point.
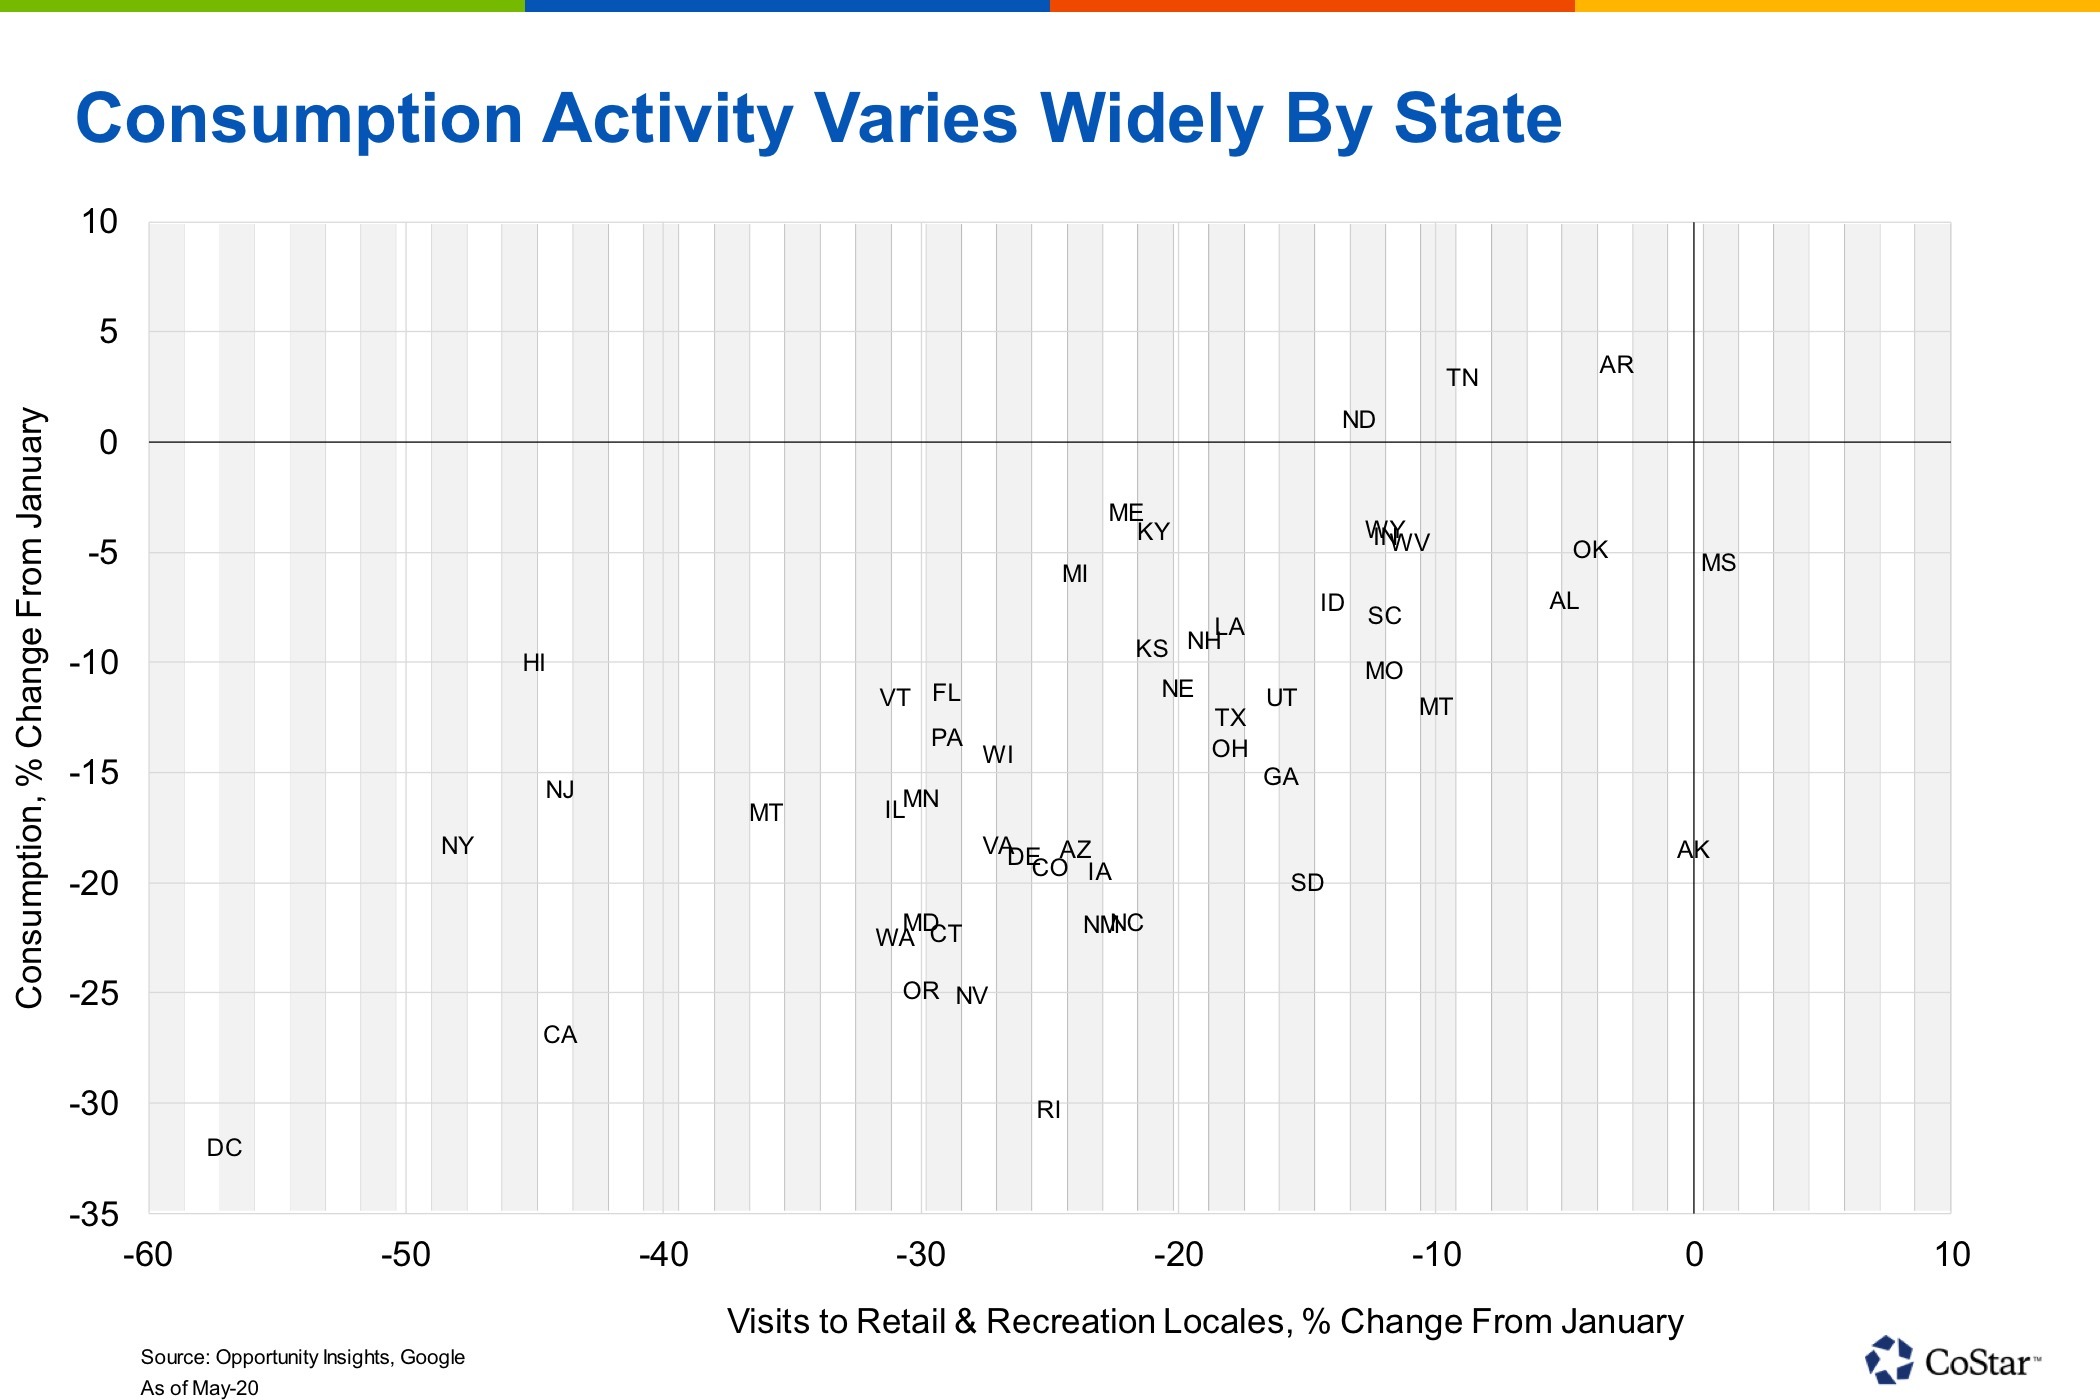
Consumption, somehow, was higher the week of May 10 than it was in January for a few states: Arkansas, Tennessee and North Dakota. At the other end of the spectrum, we are seeing spending contract by over 25% in Washington D.C., Rhode Island, Nevada and Oregon. Nevada’s inclusion is notable, given its early reopening. Georgia also reopened relatively early, but it remains stuck in the middle of the pack. As we stated last week, the dynamic is more complicated than simply who is reopening first, and makes forecasts for regional performance difficult. It isn’t as simple as “If you reopen, they will shop.”
One variable that is important is population density. It’s important for a number of reasons. It has certainly affected how quickly the virus spreads, as New York City can attest. COVID-19 feeds on density, and efforts to contain it have made travel by public transit nearly impossible in major metropolitan areas. We have been tracking Apple mobility data on walking, driving and transit for months now, and the dispersion in mobility across metropolitan areas grows wider by the day. The chart below places mobility scores for major U.S. cities against 10-mile density for those cities. The correlation is instructive without being conclusive. Also, note we had to omit New York City and Los Angeles, being much denser than everywhere else but very low, 45 and 42, respectively, on the mobility scale.

In short, people are more mobile in less-dense areas, and those places are outperforming. As we saw in the first chart, the more mobile an area is, the more people are spending. It’s much harder to spend money while you’re stuck at home. We don’t yet know how the epidemiology of the virus will play out, but this link could become more important the longer the crisis lasts.
De-densification feels like the one likely trend to emerge from the public health crisis, with families and businesses increasingly favoring the less-dense, car-dependent areas to packed central business districts. This will be somewhat dependent on another possible trend driven by the virus, one that seems to be on many CoStar subscribers’ minds these days. That is the shift by office tenants toward a more permanent work-from-home approach.
Working from home — or WFH, as many now call it — is a double-edged sword. In the short run, it could be the saving grace for a lot of economies in retaining jobs during a pandemic. In the long run, it could completely reshape traditional office demand and transform the microeconomies that have grown up around those offices. This is obviously something we are watching close, so let’s get into the framework for how we’re thinking about it.
For this inquiry we utilize an analysis by the Dallas Fed on which occupations are work-from-home friendly versus not, and then apply that research to federal Bureau of Labor Statistic data on industries and regions.
First, let’s take a look across industries, to see which have the largest and smallest percentage of jobs capable of working from home.

Professional, scientific and technical services, company management, finance, insurance and information jobs can be mostly done from home. Of course, these also make up the typical office-using jobs. On the other end of the spectrum are the obvious industries that find it difficult to work from home: restaurants, agriculture, retail, entertainment, transportation and warehousing. Many of our readers who are parents of school-aged children are finding out that educational services aren’t as efficiently done from home either.
With this analysis complete, we can apply what we learned about these industries to employment in the 50 largest metropolitan areas. Exposure to WFH jobs varies quite a bit from market to market, from under 25% in Riverside, California, and Las Vegas, Nevada, to over 40% capable of working from home in Washington, D.C., and San Jose, California.

You will notice most of the major gateway office markets toward the bottom of that chart. To directly address the susceptibility of office space by market, we look at WFH ability of office workers specifically for this same set of areas. As it turns out, 70% or more of office workers are able to work from home in the 50 largest metropolitan areas, reaching over 80% in Seattle, San Jose, D.C., Boston, New York, San Francisco, Sacramento in California, Hartford in Connecticut, Denver, North Carolina’s Raleigh, Baltimore and Minneapolis.

This is less prognosis than a spectrum of risk factors. We aren’t making a call here, just giving you a framework to think about the issue. We can see both sides of the work-from-home argument. For the better part of 20 years we have had the capability to work remotely, and we have heard that the trend was going to take off for the better part of those two decades. No longer would workers need to be shackled to expensive cities to find work! They would be able to live somewhere cheap and work remotely!
The truth is, it didn’t happen in any meaningful way. In fact, the opposite happened: Cities got more dense. Companies wanted to locate in these cities to be close to the talent that wanted to be there. We did research and learned of the benefits of density, how companies want to locate close to each other, how clustering of firms spurred innovation and growth. Go back and look at Amazon’s requirements for it’s HQ2 search. It’s request for proposals included being within 30 miles of a population center and 45 minutes of an international airport, with access to mass transit and in an area with a high-quality talent pool near universities.
So what has changed today? If life is capable of going back to “normal,” why will the remote work trend finally gain traction? If this really is a sea change, it is likely to be because everyone is being forced to do it together for the first time. And maybe it is proving skeptics wrong. Maybe it works.
The answer is likely to be somewhere in the middle. Companies will each try different approaches. Different approaches will work for different companies, and different roles inside those companies. We will keep watching, as always.
The Week Ahead …
Congress continued to argue about the details and necessity of a new stimulus package last week, but a quick resolution is unlikely as policymakers adjourned for the holiday-shortened week.
We continue to view weekly data as more useful than lagged monthly releases, but this coming week offers an exception. Personal income and spending data for April, to be released on Friday, could reveal how well implemented and utilized the Coronavirus Aid, Relief, and Economic Security Act stimulus has been. Reports seem to indicate the one-time checks, which showed up in April, have mostly been used on groceries and debt payments.
Fed Chairman Jerome Powell, as active as anyone in recent months, plans to speak again Friday in a conversation with former Fed Vice Chairman Alan Blinder. On Wednesday, local Fed banks release details on local economic conditions via the Beige Book.
CoStar Economy is produced weekly by Robert Calhoun, managing director and senior economist, and Matt Powers, associate director of CoStar Market Analytics in New York City.